07 · Web App
Urban Heat Island Intelligence
Block-level heat mapping and cooling intervention simulator for Bengaluru planners.
Overview
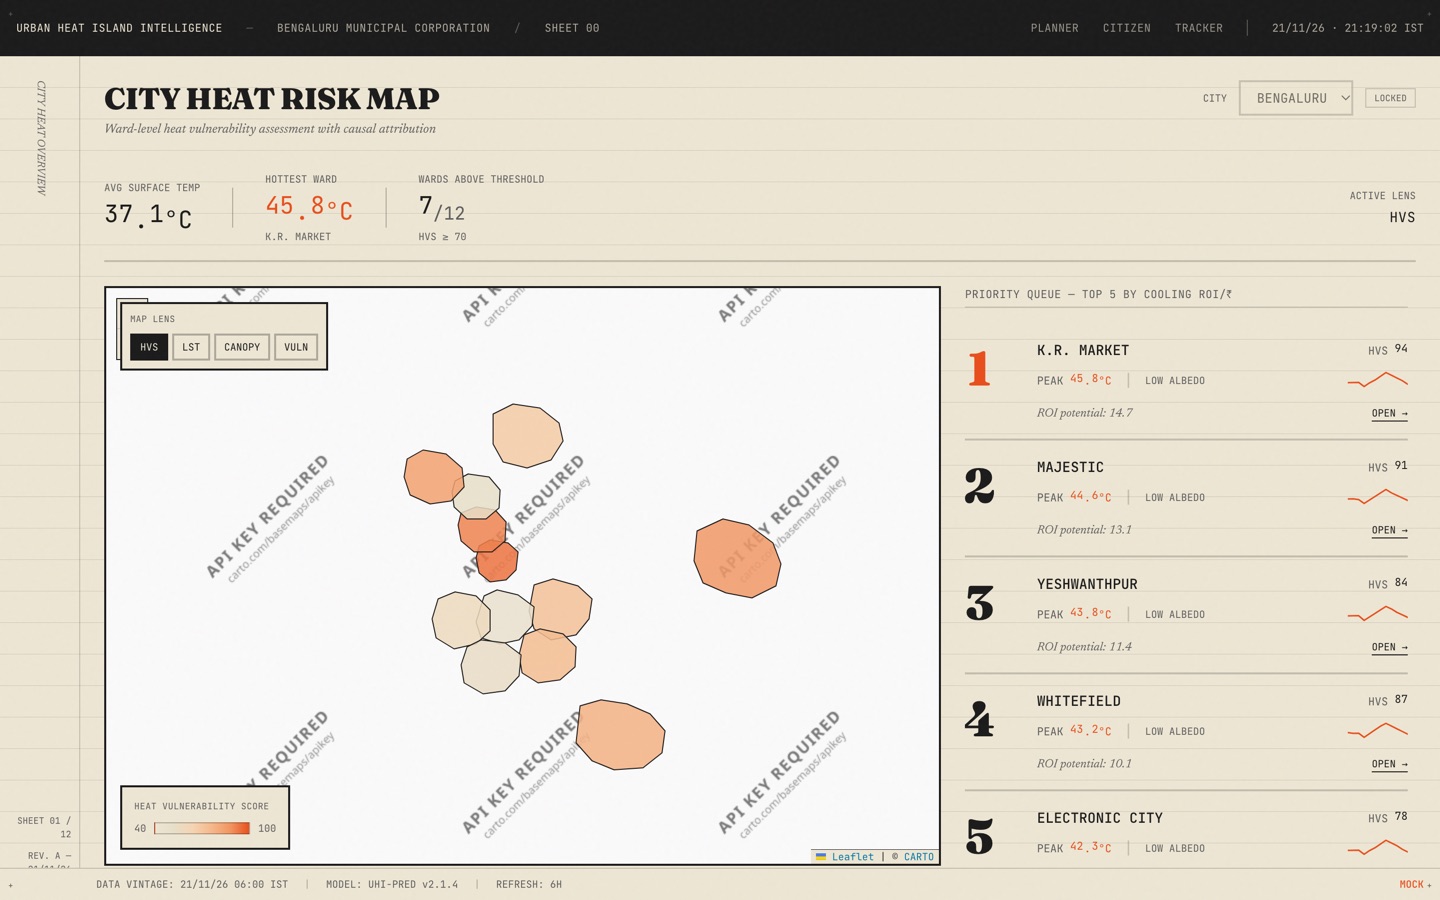
A decision engine that maps ward-level heat vulnerability, diagnoses causal factors (albedo, canopy deficit, thermal mass), and ranks cooling interventions by cost-effectiveness in rupees. Planners simulate stacked interventions — tree planting, cool roofs, permeable paving — and see real-time temperature deltas and 3-year projections.
In detail
Urban Heat Island Intelligence answers three questions no current tool combines: where (12 Bengaluru wards ranked by Heat Vulnerability Score), why (causal attribution across 5 factors with animated breakdowns), and what to do (intervention simulator with diminishing returns modeling). Planners start on a Priority Queue ranked by cooling ROI per rupee, drill into any ward for causal diagnosis and 48-hour forecasts, simulate interventions with live chart updates, and save decisions to a tracker. Citizens get a separate view with plain-language risk ratings and tomorrow's peak temperature. Built with a 1970s ISRO field report aesthetic — ruled ledger grids, Vermillion accent, zero border radius, and Mercury Tick digit animations.
Key features
- Ranks all 12 wards by cooling ROI per rupee, not just temperature
- Attributes heat to 5 causal factors with animated stacked bar
- Simulates stacked interventions with diminishing-returns model
- Saves simulations to Interventions Tracker with one-click nav
- Citizen plain-language heat risk lookup by ward name
- Animates every temperature reading with split-flap digit effect
Technology
- Next.js
- TypeScript
- Tailwind CSS
- Recharts
- react-leaflet
- Zustand
- Framer Motion